
Variance-to-Mean Ratio Parameters
Variance-to-Mean Ratio Parameters (変動対平均率パラメーター)
A, B, and VMax are parameters (Projects) used to set the variance-to-mean ratio according to the following relationship:
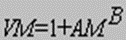
where VM is the variance-to-mean ratio, A and B are constants, and M is the annual demand for the item at an operating site. VMax is the maximum variance-to-mean ratio. Some users will want Poisson demand which is obtained by setting A and B to 0 and VMax to 1.
The parameters A and B have no heuristic significance. They are derived from statistical curve-fitting to observed field data on demands.
If set, VMax, A, and B apply to each item in the system for which the item variable VM Ratio (Parts) has been left blank. If you wish to override the environment formula value for VM on an item, enter the desired value in the VM item data field. If your system contains both randomly failing items (such as electronic components) and wear-out items (mechanical items), you should set the global parameter values to account for the random items and enter item data for wearout items (whose VM ratio values tend to be smaller than 1).
Some empirical work has been performed on demand prediction for the U.S. Air Force in which demand rates do not stay constant, but tend to “drift” over time. In this type of application, it has been found that values of 0.14 and 0.5 for A and B, respectively, are appropriate. In such a case, the demand over a period of time is assumed to be negative binomial with a variance-to-mean ratio as specified above. For non-Poisson demand, a maximum variance-to-mean, VMax, of 20 is suggested.
In the U.S. Air Force studies, several sets of data were used: a random sample of all Air Force reparable items, reparable items for the C-5, reparable items for the F-15, reparable items for the F-16 and reparable items for the A-10. The procedure for each item was to use the best technique for estimating the mean annual demand, M, (typically exponential smoothing with a smoothing constant of 0.4 on quarterly data), A = 0.14 and B = 0.5 and estimate the variance-to-mean from the formula.
When $80 million was allocated optimally across the items of the C-5 using the Poisson assumption, the predicted availability for the next year was 0.986; however, using the actual data for the next year in a simulation the achieved availability was only 0.566. With the suggested formula for variance-tomean, the predicted availability was 0.771 and the achieved availability .828. That is, the achieved availability was much higher and the predicted availability was much closer to the achieved value.
With $100 million on the C-5, similar results were observed: a Poisson approach predicted an availability of 0.999 and achieved 0.622. The suggested formula for variance-to-mean predicted 0.911 and achieved 0.913. Similar results were obtained for the F-15, F-16 and A-10. The suggested formula for variance-to-mean appears to work well for U.S. Air Force applications. It will always require larger investments than the Poisson assumption for any target availability. However, the Poisson assumption with a known, constant mean is unrealistic and leads to a poor allocation of funds across items. The adequacy of this formula in other applications depends on the degree of problem similarity.
« Back to Glossary Index